
Value Compounding Rate: The Missing Valuation Metric
Most investors chase revenue and EPS growth like it’s the whole story. But the real engine of long-term returns? A company’s ability to reinvest and compound value over time.
Author’s Note: This article lays out the core thesis behind my analysis style — the foundation for future articles and company breakdowns.
Why did you invest in a business or stock? Why not a bond instead?
The main reason? Businesses compound value - something bonds don’t do.
This means the cash flows of a business can be reinvested to grow earnings, capital, intangible investments, and value at an exponential rate.
But do you know the actual compounding rate of your portfolio companies?
Hint: It’s not simply revenue or earnings growth rates.
How many analyst reports do you read where they calculate a company’s compounding rate?
How many CEO’s & CFO’s discuss or measure this in annual reports or on earnings calls?
ANSWER:

Why?
Most investors skip this step because it’s not easy — it takes judgment, not just formulas. But that’s exactly why it matters.
This article discusses the following:
Why I think VCR is the ultimate value formula
What is the Value Compounding Rate (VCR) & how is it calculated
How to use it to forecast the future
Why I Think VCR is the Ultimate Value Formula
Buffett and Munger have made billion-dollar investments for decades with tremendous success. Yet they openly claim they don’t use spreadsheets or formal financial models to estimate value.
“If you need to use a computer or a calculator to make the calculation, you shouldn’t buy it.” - Warren Buffett1
“Some of the worst business decisions I’ve ever seen are those with future projections and discounts back. It seems like the higher mathematics with more false precision should help you but it doesn’t.” - Charlie Munger
“Warren often talks about these discounted cash flows, but I’ve never seen him do one. If it isn’t perfectly obvious that it’s going to work out well if you do the calculation, then he tends to go on to the next idea.” - Charlie Munger2
That sounds crazy today. Imagine pitching a billion-dollar stock idea without an elaborate Excel model — you’d be laughed out of the room.
But there’s a reason: they didn’t grow up with excel models or handheld calculators. They focused on business fundamentals using straightforward math calculations — understanding the real drivers of long-term value.
I believe one of the tools they use (whether consciously or not) is the Value Compounding Rate (VCR).
What is the Value Compound Rate (VCR)?

Think of VCR like a flywheel. A business generates cash, reinvests it, and earns more on the reinvestments. That cash gets reinvested again — and the cycle repeats. Over time, this creates exponential growth in value.
The VCR looks at the past period, generally 5- to 10-years - or more - and makes an estimate of 2 key variables:
Reinvestment Rate (RR): How much capital was reinvested into the business as a percentage of profits?
Returns on Incremental Invested Capital (ROIIC): The incremental return on invested capital earned during that period.
Multiplying these two gives you the VCR, an indication of growth based on past reinvestment rates & the returns earned on that reinvested capital. (Aswath Damodaran has many discussions on this topic as well.)
The VCR is like the idea: it takes money to make money. Long-term sustainable growth requires continued reinvestment. And that reinvestment can be in the form of increased operating expenses, human capital, working capital (A/R inventory, A/P), internally created intangible assets through R&D spending, leases, capital expenditures, or acquisitions. It is our jobs as analysts to track and measure managements effectiveness & performance of these investments.
Netflix Example
From 2015 to 2024, Netflix reinvested $23.3 billion back into the business — about 77% of its $30 billion in earnings.
That reinvestment earned a 31% return on incremental capital - the ROIIC.
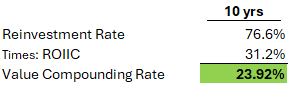
The result? A VCR of 24% annually — which aligns remarkably with the stock’s return of 25.6% per year over the same 10-year period.
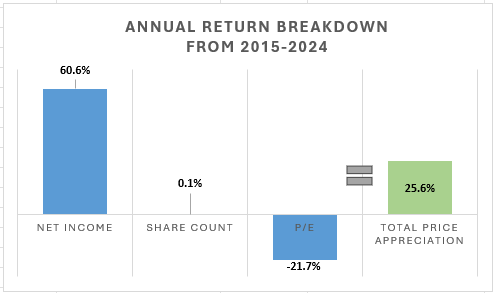
Analyzing this from a Prie-to-Earnings (P/E) ratio perspective, net income grew 60.6% per year - juiced by additional leverage in the business, from 2015-2024, with some minimal share dilution (0.1%), and a contraction in the P/E multiple (-21.7%), equating to a 25.6% return.
To note, the compounding rate approximating the stock return isn’t always this close, but generally will be close over long periods.
Capital Allocation - Sources & Uses
Warren Buffett clearly articulates the power & importance of management’s impact and ability to allocate capital proficiently. His comments underscore that even a low reinvestment rate leads to a large magnitude of allocated capital over time:
“The lack of skill that many CEOs have at capital allocation is no small matter: After ten years on the job, a CEO whose company annually retains earnings equal to 10% of net worth will have been responsible for the deployment of more than 60% of all the capital at work in the business.” - Warren Buffett, 1987 Shareholder letter
To further support the reinvestment rate (RR) analysis, it’s important to see how companies earn (Sources of Capital) and deploy (Uses of Capital) capital.
This step is to compare what management says versus what they do. Many times management is very excited about opportunities, only to find out, these investments are small and don’t move the needle in terms of reinvestment rates or returns on incremental capital.
Companies can internally source capital from:
Operating cash flow - cash flow derived from ongoing operations.
Divesting fixed assets and business units - selling off fixed assets or business units (including intangible assets).
Companies externally source capital by:
Issuing Debt
Issuing equity
Exercising stock options
Companies use capital for 2 main reasons, internal or external uses. Internally companies use capital for organic growth or acquisitive reasons.
Organic growth investments include working capital, leases, capital expenditures, and research & development (R&D).
Capital expenditures are mainly broken up between maintenance & growth. A proxy for maintenance capital expenditures is generally depreciation with some level of inflation factored into the amount. Growth capital expenditures are estimated to be capital expenditures beyond depreciation (including inflation).
Non-organic growth comes from acquisitions of businesses or purchases of intangible assets like patents, customer lists, and trademarks.
Externally, companies can use capital to repay debt, pay cash dividends, or buyback shares.
Below is the capital allocation of Netflix over the past 10 years:
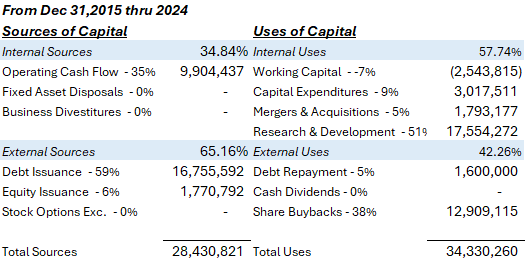
Netflix internally used $34 billion for content spending (categorized as R&D above) and share buybacks. Financing sources included $9.9 billion from operating cash flow and issuing debt & equity. We see that company has probably reinvested about 57% of its capital for internal purposes. Any remaining cash flow went to the balance sheet.
(My analysis excludes excess cash from working capital. Excess cash is calculated as any cash balance over 3% of revenues.)
Our intention through this analysis is not to be exact. The illusion of precision can lead to a faulty sense of control & presumed accuracy.
Instead, this analysis helps us understand what the company is actually doing. We see from the RR calculated earlier, the company retained 75% of their earnings. Of the total capital used, they allocated about 57%.
Netflix has been reinvesting between 57%-75% back into the business over the past decade. Further analysis shows that from 2015 to 2024, Netflix’s cash & marketable securities went from $2.3 billion to $9.5 billion, supporting the notion that not all the capital was reinvested into internal investments but some to cash and cash equivalents.
What this analysis can help capture is how well a company is reinvesting earnings. Many companies, like Berkshire Hathaway, retains almost all of their capital, however, they do not always reinvest it inside the business, hence Berkshire’s $300 billion cash balance.
Nike Example
Nike is one of the most recognized brands on earth, earns higher ROIC and incremental ROIC, but over the past 10 years the stock has performed poorly, almost flat over that time period.
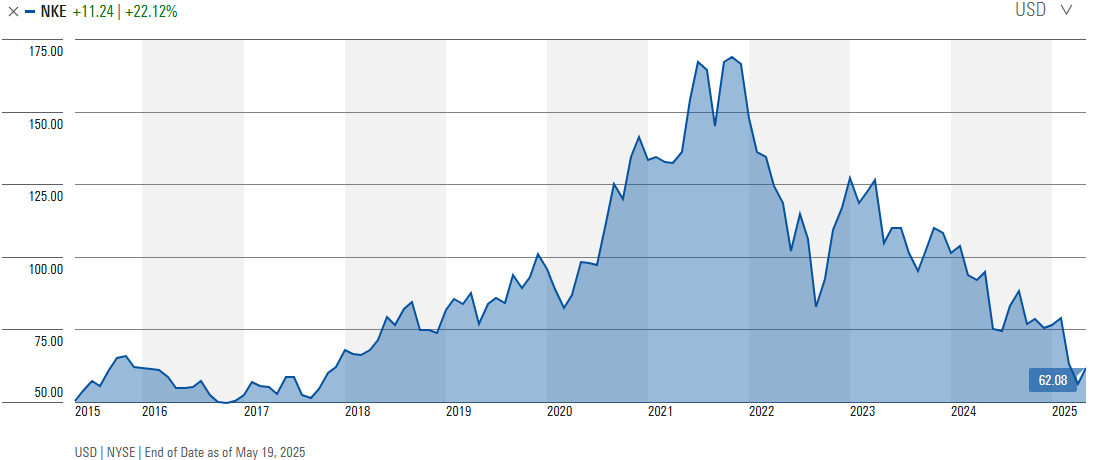
It’s not surprising the stock hasn’t moved much because Nike retained very little capital and returned ~75% of it’s capital to shareholders:
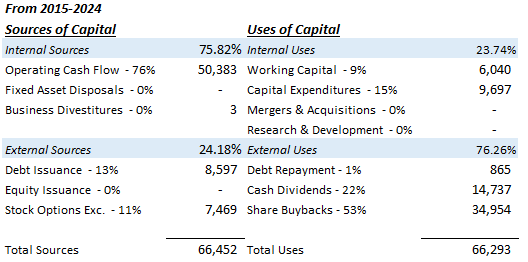
Nike earns high returns on invested capital and incrementally invested capital:
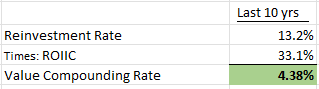
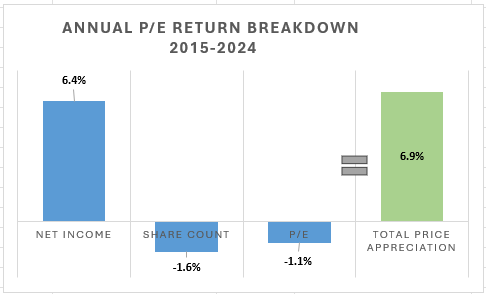
Although Nike earns high ROIIC, since it reinvests 13%-24% of its earnings & cash flows, respectively, back into the business, it’s VCR approximates inflation. The Company has added debt, and bought back 1.6% of shares annually, so it’s no surprise equity returns were closer to 7% annual rate over the 10 year period.
VCR Assumptions
The VCR is a great tool to review the effectiveness of management’s capital allocation skills and add in a level of accountability. Keep in mind some key assumptions, the VCR:
Is backwards looking. The numbers alone do not represent the future. However, a company’s past investments & ROIIC establish base rates to forecast the future.
Is looking at total capital to all stakeholders, irrespective of leverage. The VCR is looking at growth at the enterprise value level. Equity returns can be higher (or lower) depending on whether companies utilize debt, buyback, or issues shares.
Includes cash, meaning some reinvest may sit on the balance sheet. Keep in mind, many companies do require some level of cash to operate. The rest would be considered a non-operating asset.
VCR: Back of the Napkin Forecasting Tool
The forecasting ability of the VCR allows you to make sensible estimates of the future with some very simple inputs.
Do the following:
Reinvestment Rate: Use the historical analysis as your base rate and then using recent news announcements, investor calls, presentations, or other analysis, determine if that number should be adjusted up or down.
You can also do scenario analysis to see what different levels of reinvestment will move the needle for the business.
ROIIC: Use the historical ROIIC as your base rate. The ROIIC can be bifurcated into 2 ratios: a Sales/Capital (capital efficiency) ratio and a NOPAT/Sales (profit margin) ratio. By bifurcating the ratio, you can estimate increase or decrease future margins and capital efficiency. You can make estimates here to forecast future incremental returns on invested capital. Competition lowers returns, and that historically comes from reduced profit margins over time.
Using Nike as an example, the company has typically reinvested 13% of it’s earnings & 24% of its cash flow, earning a 33% ROIIC. Nike appointed a new CEO in September 2024, who is looking to spur growth. In the past the company has take missteps with brand positioning & sales channels, that the company is working to address. Looking forward the leadership has this to say:
“I'll list the near-term priority actions again: ignite our culture through a focus on obsessing sport and getting back to winning; accelerate a complete product portfolio driven by athlete insights through sport-led fields of play; increase investment in our brand to deliver big, bold marketing statements; invest in and empower our teams in key countries, in key cities to win the ground game; elevate the marketplace through a more premium NIKE Direct and an unwavering commitment to our wholesale partners.” Elliot Hill, CEO, First Investor Call
“The net effect of these actions will result in lower revenue, additional gross margin pressure and higher demand creation expenses.” - Matt Friend, CFO
Comments like these suggest that investments will be made at the at the expense level, lowering profits in the short term. There is no concrete mention of other investments into the business, like growth capital expenditures or acquisitions.
Using the VCR going forward, we can adjust our numbers:
Reinvestment Rate: It isn’t unreasonable to assume that the new CEO will continue to reinvest between 13%-24% back into the business at this time. Nothing substantive mentioned in management’s discussion indicated this would be materially different (so far).
ROIIC: We do believe that the ROIIC will decline as most investments seem to be expenses, from the CEO & CFO’s comments. We can bifurcate ROIC into two components, the asset turnover & NOPAT margin. Historical ROIC has declined from 2015 to 2024, which is evidenced by the 33% ROIIC reported earlier.
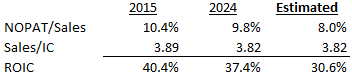
If Nike continues to have lower margins, say 8%, and continues with its same capital efficiency ratio of 3.8x, we can see ROIC approaching 30%.
Using these assumptions, the VCR will decline from 4.9% to 3.9%. To reverse this trend management can improve ROIC or improve investments.
If you think I am wrong, the benefit of this analysis is you can put in your assumptions, and see how it changes the analysis.
Summary
My hope is this analysis is a useful overlay to your current analysis. It’s one thing to listen to what management is saying, but a good analyst will track & measure the impact of management’s actions.
Additional Resources
John Huber on ROIC and reinvestments. He wrote articles in the past that lead me to this analysis. I thank him for his research in guiding my own work.
Anything written by Michael Mauboussin
I do not own or plan to own any of the stocks mentioned in this analysis. I may own these stocks indirectly through index funds. This article is for educational purposes only.
https://www.wsj.com/articles/BL-MB-6658
https://thetycoonist.com/2020/11/11/how-warren-buffett-and-charlie-munger-discount-future-cash-flows/